First, I have some bad news. My data provider decided to stop shipping futures data to me (it was a free service which I’ve used for over five years) – the last updated value was Thursday at end of day. So, my charts for all futures contracts in this report end on Thursday. Now, I have to scramble around and buy an end-of-day futures feed from someone else, get it working, make sure the data is similar enough – all before next Saturday. “Good luck with that.” So today, data is just through Thursday (6/30) for the futures charts.
Currently, I’m exploring the “impending recession” thesis – from both Chris and Ed Dowd, through a number of different lenses.
First, I’m told there is “credit contraction” happening. So, I dug out an old favorite, a FRED series called LOANS: the total number of outstanding bank loans and leases in the U.S. (through May), charted alongside the U.S. recessions (red lines). You can see that bank credit (black line) did start falling roughly in the middle of the recession, but it wasn’t the most timely indicator. Conclusion: total bank credit is not a great leading indicator, and if credit contraction is happening today, it isn’t showing up in LOANS.

Here’s another credit series: “U.S. FINRA margin debt” alongside recessions in red. Unlike the broader bank credit series, margin debt appears to be much more predictive. Often, when the margin debt contracts, a recession is in the offing. In the current cycle, margin debt started falling back in November of 2021. Implication: a recession is probably incoming. We might well be in one now. See 2008? That kinda feels like where we are now. Just minus the red line indicating recession, which always appears 3-6 months later.

Now, about rate increases. Is the Fed about to start printing money in response to this impending recession?
The chart below shows the futures market is predicting a +150 basis point rate increase (to 3%) by Nov 22, 2022. That’s what they show today anyway. So for now, the Fed is predicted to tighten, right into the Financial Industry Regulatory Authority (FINRA) margin debt-predicted recession. Ouch.
https://www.cmegroup.com/trading/interest-rates/countdown-to-fomc.html

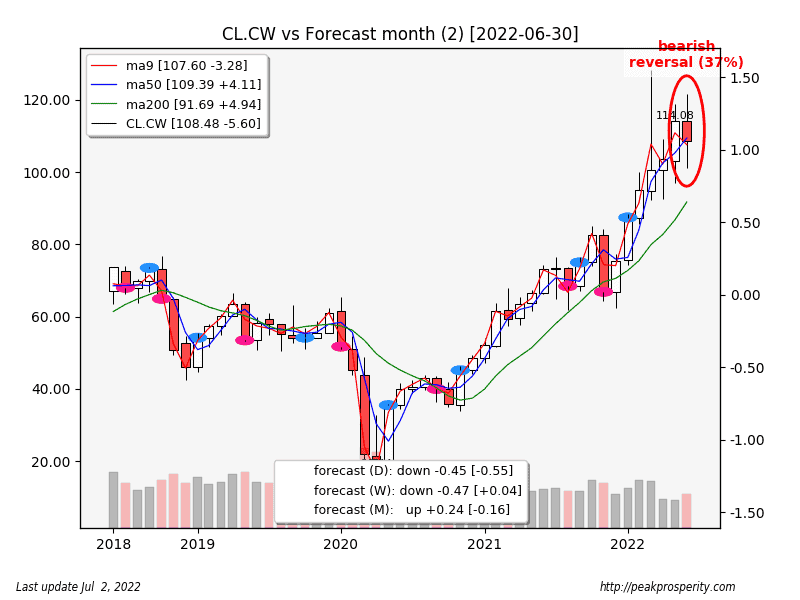
If the price of crude [down -5.60 to 108.48] is “The New Fed Funds Rate”, crude remains in a “tightening” uptrend. Sure, we see a reversal candle this month, but not a very strong one. Will crude keep rising due to peak oil, and the calculated stupidity of President Grandpa’s WEF-trained reserve-draining Handlers? Shortages will be the driver for oil prices, rather than money printing or rates. I suspect it will take massive “demand destruction” to drag crude oil prices back down to earth. Who knows though. We might see that, given time.
Note: in February, prior to the Grand Price Hike from Russia, crude was roughly $90-100, and it closed this month at $108.

Here’s more on “oil shortages”: a combo chart that merges both the Strategic Petroleum Reserve (SPR), and the commercial U.S. oil stocks. The pair are down roughly 20% from early 2021 (1.14 down to 0.913). The rate of decline in oil in storage appears to be accelerating; almost 10 million barrels this week alone.
Note too that the plunge in crude oil stocks started in 2021, long before “the Putin Price Hike” happened in March 2022. I think: the storage-drain is an in-kind campaign contribution, made by the Biden-Handlers for the benefit of their figurehead, paid for by You and Me, using the SPR.

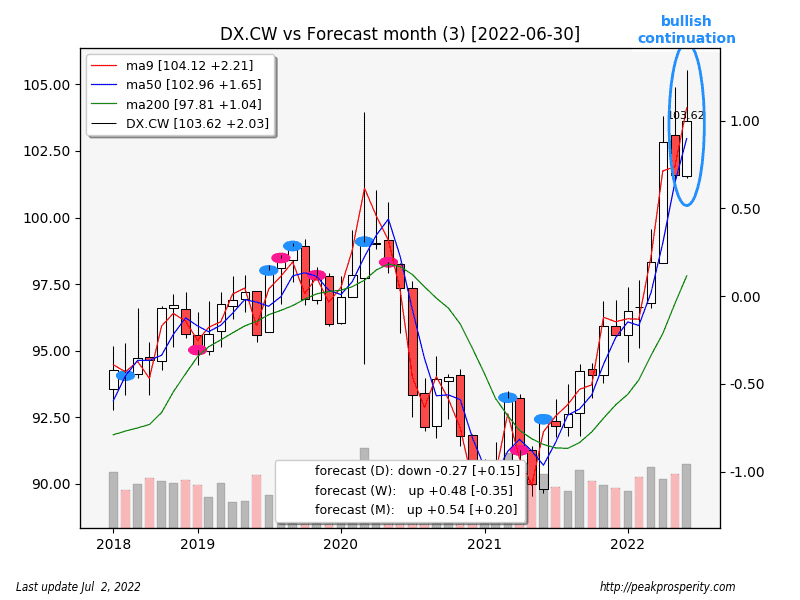
Here’s a slightly-outdated (last tick: 6/27) USD monthly chart. A rising dollar is risk-off and/or suggests contraction. How much of this is money fleeing Europe? Probably quite a bit. Poor Germany, 55% of its natural gas supply comes from Mister Price Hike. Half of the DX (U.S. Dollar) rally came in the last four months – we can probably give Putin (and/or the “strategy” by NATO, and the G7) all the credit for the dollar rally. To add to this: Winter is Coming.

And then there is Doctor Copper. Down -0.51 [-11.92%]. Ouch. About half the time Copper gets it wrong, but it is hinting that we have a recession in the offing, if not here already. Although, it could also just be something China-specific. [Construction, Evergrande bankruptcy, etc]. Copper shows things were inflationary right up until March.

The CRB (commodity research bureau) index is a commodity price index referenced by Ed Dowd. Ed believes that commodity prices may have topped out, which is also projecting recession. The CRB chart is showing a technical trend reversal. This week it closed below the previous low set in early May. Is CRB predictive? I don’t know. I don’t have the CRB series locally, so I can’t chart it against U.S. recessions to see.
https://tradingeconomics.com/commodity/crb

And here’s the UN’s Food and Agriculture Organization (FAO) food price index, which seems to be (very roughly) tracking the CRB. It is no longer screaming higher. Has it too topped out? Maybe. The fertilizer-scarcity-driven “global starvation event” (more evidence coming in September/October) has yet to play out. Something to watch.
https://www.fao.org/worldfoodsituation/foodpricesindex/en

Gold fell -10.55 to 1831.31. A modest move down. Gold remains in a downtrend, but the low levels of open interest (OI) suggest that the banksters aren’t so eager to jump in short here. More likely we’re nearer a low than a high. I know, I keep saying that, but that’s the pattern with OI: the lower the OI, the more likely we are at a low. Although we probably have to wait for the Fed to hint at reversing course before the gold reversal actually happens.

My current sense:
- The Fed is tightening into an impending recession (as predicted by the seven-month FINRA margin debt decline). How long will the Fed really continue to tighten? Futures currently predict: November, by 150 bp. I’m guessing that will change. This is the indicator I will be watching.
- Commodities overall (except crude) may have topped out; another impending-recession hint.
- U.S. crude in storage is finite; 45 days of U.S. consumption. The WEF-Biden-Handlers seem very eager to drain our emergency petroleum reserves. Because “Climate Change!” Or, “No More Superpower For You!” Or, they’re just really stupid. Or, they’re working for Xi, “10 held by H for the Big Guy.” Take your pick.
- Any reversal by gold probably awaits that Fed policy reversal.
Economic Direction:
- ‘One Of The Worst Downturns’: Mark Zuckerberg Blasts Biden’s Economy In Warning To Employees
- Michael Burry Agrees: “Bullwhip Effect” Will Force Powell To Pivot On Rate Hikes And QT
- Sri Lanka Suspends Fuel Sales Amid Economic Collapse; Asks Russians For Help. Gasoline Lockdown for the Sri Lankan Plebes.
- G7 Mulls Russian Oil Price Cap as Sanctions Fail To Curb Russia’s Profits. Putin, China and India must cooperate for the West’s “oil price cap” wishlist-item to work. Meanwhile, Russia rakes in the bucks.
- Euro zone inflation hits record 8.6% as the European Central Bank prepares for its first rate hike in 11 years. Horse is long gone, but the European Central Bank (ECB) will close the barn door shortly.
- Eurozone Whacked by Runaway Inflation, “Fragmentation” Fears after Years of Negative Interest Rates and Reckless QE. “By mid-June, the German 10-year yield hit +1.75%, and the Italian 10-year yield spiked to 4.17%…This was when “fragmentation” talk hit the front pages.” Apparently fragmentation is bad – a potential default indicator – which is where Big Money prefers German bonds over Italian bonds.
- Biden admin delays decision on expanded offshore drilling.Who needs to drill for oil when you can try groveling at the feet of former-pariah Mortgage-Backed Security (MBS)?
Spike Protein News:
- NIH admits U.S. funded gain-of-function in Wuhan — despite Fauci’s denials. Yesterday’s conspiracy theory.
- America Is Sliding Into the Long Pandemic Defeat. The Atlantic appears irritated that nobody seems to care much about the virus anymore; the pandemic-gives-life-meaning thing is fading away.
- Our Latest Poll is Devastating for the Official Narrative: “A 6.6% rate of heart injury, 2.7% are unable to work after being vaccinated (five million people), 6.3% had to be hospitalized, you’re more likely to die from COVID if you’ve taken the vaccine. This survey indicates that over 750,000 people died from the vac.” [stkirsh]
- U.S. Army Lowers Education Requirement For Enlisting. “The U.S. Army is dropping its high school diploma requirement.” Biden-Handlers lower standards after force-vaccinating (slash purging) the warfighters. Xi = laughing in the distance.
- July Fourth Travelers Face Thousands of Flight Delays, Cancellations. Due to “climate change”, or “weather”; definitely not due to staff shortages stemming from heart injury, disability, or clots.
- Swedish Birth Rate Data: What Does it Really Show us? An 11% drop in births, happening nine months after the big vax campaign where 50% of Sweden got the shot.
Ukraine:
- German Journalist Faces Three Years Prison Over Reporting From Eastern Ukraine. Democracy Dies in Darkness.
-
EU Gives Ukraine Candidate Status But The Path to Actual Accession Will be Long and Arduous. Turkey is still waiting as a “candidate” after more than 20 years.
- Global Energy Cleaving Continues, Iran and Argentina Apply to Join BRICS Economic Partnership. “The objective of the BRICS group is simply to present an alternative trade mechanism that permits them to conduct business regardless of the opinion of the multinational corporations in the “western alliance.” The BRICS (Brazil, Russia, India, China, South Africa) opportunity is the unintended consequence of the genius strategic moves by the G7, the WEF billionaires, and President Grandpa’s clueless Handlers.


