

Consumer Economy
- Durable Goods, New Orders (DGORDER) 321.2B -134.00M (-0.04% m/m)
- GDP (GDP) 31.44T +344.5B (+1.11% q/q)
- Personal Income (PI) 26.70T +113.8B (+0.43% m/m)
- Existing Home Sales (EXHOSLUSM495S) 4.09M +70.0K (+1.74% m/m)
- CPI All Urban (CPIAUCSL) +0.27% m/m
Durable goods orders were mostly flat, but the overall level is more expansionary than recessionary.
GDP revisions [Q4] show nominal GDP at 4.4% annualized, but “adjusted for inflation”, Q4 GDP was up just 0.162% q/q, or 0.648% annualized. Not BOOMING [i.e., recessionary].
US Q4 GDP Growth Cut In Half To Just 0.7% After Revision [Mar 13]
(source – zerohedge)
Existing Home Sales [at least using FRED data] inched higher, but remain near multi-year lows. Related: homebuilders aren’t doing so well right now.
While CPI doesn’t look all that dreadful [3.24% annualized – which we know is a gross understatement], the core PCE looks a bit worse. Looking at the charts provided by Wolf, the “Core CPI” increase appears to be a 2-3 month trend change to the upside, and this is happening prior to any Bomb Bomb Bomb Iran affecting the data.
Core PCE Inflation Hits 3.1%, Worst in 2 Years, in Unique Twist Blows way past CPI Inflation. Driven by Core Services
(source – wolfstreet)
So let’s see: GDP inflation revised higher, effective GDP lower, core PCE inflation rising, and a crude oil rally in progress. That might be called “stagflation.”
Credit & Rates
- Total Bank Credit (TOTBKCR) 19.30T +44.0B (+0.23% w/w) (prior -0.03% w/w)
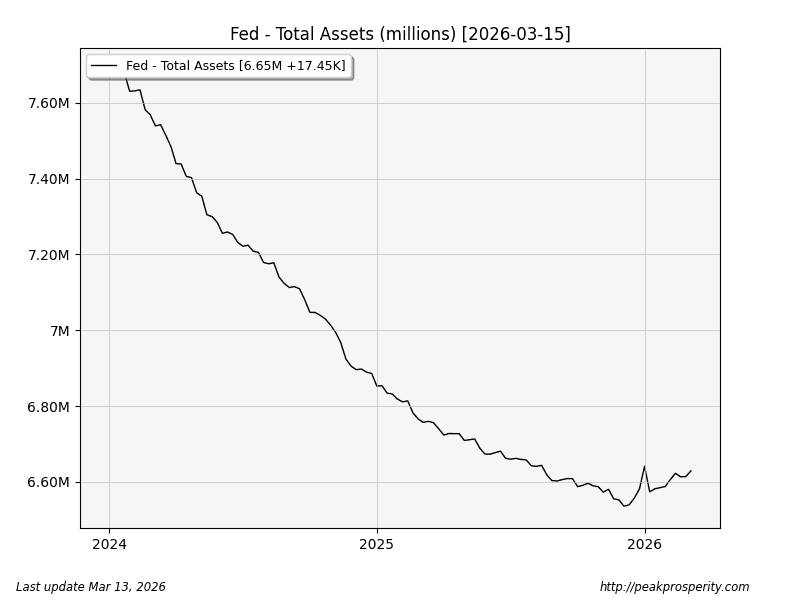
- Fed Balance Sheet (WALCL) 6.65T +17.4B (+0.26% w/w) (prior +0.23% w/w)
- US 30 Year Mortgage Rate (MORTGAGE30US) 6.11% +11 bp
- 3-Month Treasury (DGS3MO) 3.69% +0 bp
- 1-Year Treasury (DGS1) 3.64% +9 bp
- 10-Year Treasury (DGS10) 4.29% +14 bp
- 20+ Treasury ETF (TLT) -2.17% w/w
Bank credit is expanding once more. At least for now.
Mortgage rates jumped higher – it’s roughly the 30-year treasury plus 1%, give or take. Higher rates probably won’t help the housing market.
The Fed did some money printing again this week; 17 BILLION dollars were printed. Here’s what that looks like in context over the last couple of years. It’s not a factor just yet, in my opinion.
Most treasury instruments were hit hard for a second week in a row. While there were no changes in the 3-month and 6-month yields, the longer-dated items rose 14-16 bp. Even the

