There were a number of economic reports this week:
- Personal Income: +0.36% month over month (m/m), prior +0.68% m/m. Still positive, but slowing.
- Durable Goods: new orders -2.13% m/m, prior +0.735 m/m; topping out. Bearish
- Median New Home Sales: +7.57 m/m, prior +3.14% m/m. New all time high.
- Personal Income: +1.3% quarter over quarter (q/q), prior +1.2% q/q. Bullish, although (annualized) it does not keep up with inflation.
- Auto/Light Trucks: -6.98% m/m, prior +9.84% m/m. Possible reversal. Bearish.
Editor’s Note: The Weekly Market Update was delayed one day because of the Christmas holiday.
The macro data looks mixed this week. That said, it is bad to see durable goods orders go negative – orders are “next month”, versus most of the other indicators which represent “last month.” Auto/truck sales look ugly too, and personal income is slowing down. I’d also interpret the jump in median new home sales prices as “only the rich can afford a new home” – which caused median price to move higher. Overall, things look mildly bearish; we could be approaching a turning point overall.
The buck fell this week, losing -0.32 [-0.31%] to 104.41. Although, the big fuss this week was driven by the BOJ backing off from its money printing, all the drama didn’t seem to affect the dollar all that much overall – even though JPY rallied fairly strongly [+2.69% vs U.S. dollar (USD). But in spite of that, the buck didn’t even make a new low. It looks to me as though the buck is chopping sideways; it even managed to close back above the nine moving average (MA). No bullish reversal just yet though. The daily chart looks a bit more positive than the weekly.

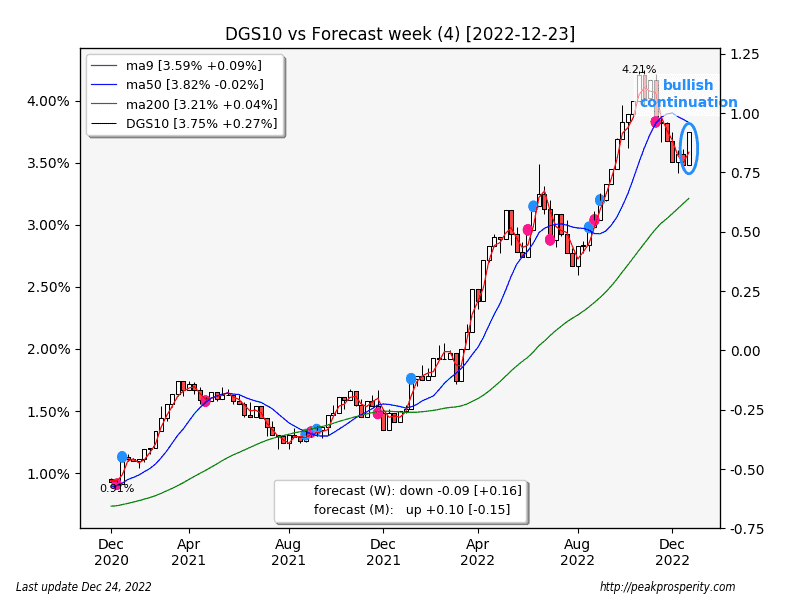
The 10-year yield rose 27 basis points (bp) to 3.75%. Treasury bonds are being sold – my guess by the Japanese, who are repatriating their USD investments after the BOJ move. This is why Armstrong always tells us to watch capital flows. Right now, money is flowing out of the U.S., and back to Japan, so U.S. assets are being sold, and JPY moves higher. One asset apparently being sold is the 10-year Treasury, which causes the yield to rise. No reversal signal yet from my various models, but – just using my eyeball, that’s a 3-candle “swing low” in DGS 10 (a configuration that is not in my model) which might mark a reversal. With the various central banks deciding to defend their currencies (using rate increases in various ways – ECB, BOJ, BOE) – its hard to sort out direction for a particular instrument, but I don’t think I’d be long the 10-year right now. When the interest rates rise, bond prices fall. Not financial advice.

Gold mostly went nowhere this week, up 4.00 [+0.22%] to 1804.20. Gold remains just above its 200 MA. It is hard to say what gold’s trend is right now. Did it run into resistance here at $1800? If we just look at the gold chart, that’s what it seems like.

Market Update Part 2: In our ongoing effort to provide value to our Insider and VIP subscribers, Dave Fairtex’s weekly market update has been moved to the subscriber levels. If you are not an Insider or VIP, but want to read the rest of this important report, please consider joining to enjoy access to this information, and more.


