


Wednesday, June 18, 2008
Executive Summary
- Relatively benign stock market index performance is masking severe financial weakness
- Judging by their stock charts, several good-sized banks might file for bankruptcy soon
- Financial market liquidity supplied by the Fed is at odds with their words that "credit market conditions are improving"
- The assets of the banks under duress are many, many multiples of total FDIC assets
"Pay no attention to the man behind the curtain!" barks the booming voice.
Unfortunately for the dumpy, balding ‘wizard,’ the curtain has already been removed and he’s been spotted.
The first two weeks of June (2008) have been all about knowing where to look. Let’s peel back the curtain.
Let me begin with a personal story. One of my main trading accounts was with a company called Lind-Waldock, a very reputable, stable, old company that got bought out by fast-flying Refco. All seemed well for the first few months, I had the same broker at the other end of the phone and I noticed no difference in my trading experience. But I was wary of Refco, so I kept a live stock chart up on my computer monitor, which I kept a close eye on. One day, the stock price of Refco took a stomach-wrenching dive, losing nearly 20% in a single hour. I immediately called my broker and shifted my funds out of that company that very day. I even got a call from the head of the division asking me to remain, insisting that all was well, and explaining that the stock was falling on the basis of unsubstantiated and certainly untrue rumors. It turns out that the rumors were true; Refco was involved in some shenanigans and had clumsily tried to hide billions in losses by stuffing them in an off-shore subsidiary. Refco was actually insolvent and ultimately went bankrupt. And it was also true that my money would have been safe even had I not moved it, but my position on these matters is to bring the money home and ask the detailed questions later.
Below you will see many examples of stock price performance that would cause me personally to remove my money to a safer location and save the questions for later.
After the dangerous downdraft in the dollar and the stock market seen on Friday the 6th of June, the Federal Reserve and their brethren in Europe, the ECB, were all over the airwaves beginning Sunday the 8th in an attempt to prevent the markets from selling off any further. Judging by the headline stock index performance, they did pretty well, as the indexes closed more or less unchanged for the week. However, if we peek behind the curtains, we see something very different.
I want to focus on the issue of banks and bank solvency. Actually, I want to broaden this definition to include what are termed "financial institutions," which include mortgage brokers and commercial lending institutions. Why? Because we are now a financial economy. Measured in dollars, our economy has much more activity in the business of moving money around than it does in the manufacturing real goods.
It used to be said that "as goes GM, so goes the US," meaning that the economic health of the country could be measured by the activity of its (formerly) largest manufacturer. Now it might be said that "as goes JP Morgan, so goes the country."
Here are the warning signs that major and probably systemic financial distress remains threaded throughout our economy like termite tunnels in a load-bearing beam.
The Fed’s words and actions are not aligned
Bernanke recently said that the risk the economy has entered a substantial downturn "appears to have diminished over the past month or so," while Alan Greenspan said that financial markets have shown a "pronounced turnaround" since March. Which leads us to the recent inflation-fighting words of Bernanke, who said that the Fed would "strongly resist" expectations that inflation will accelerate, hinting at the possibility that interest rates will be raised. Of course, all of these are simply words. What are the actions?
Since you and I know that inflation is caused by too much money lent too cheaply, we’ll spend less time listening to words and more time looking at the monetary data. In other words, let’s pay attention to what they are doing, not what they are saying.
Through a combination of Federal Reserve and Treasury actions, the total amount of liquidity that has been injected into the banking system has advanced over $40 billion in the last 10 days, smashing to a new all-time record of more than $307 billion dollars. If the worst was behind us and inflation was a real concern, this would not have happened. The actions here tell us that the fear of whatever is ailing the banking system vastly outweighs any concerns about inflation.
Further, short-term interest rates are set at 2.0%, which is a full two percent below the rate of inflation. What do you get when you combine negative real interest rates with extremely loose monetary policy? Inflation.
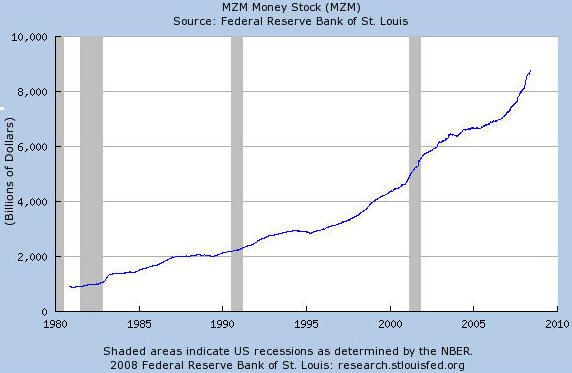
And finally, here’s a chart of the money supply of this nation. If this was a roller coaster ride, you’d be pressed back in your seat staring at the sky – not unlike oil, grains, and other basic commodities.
 So there you have it: On the one side, record amounts of liquidity, deeply negative real interest rates, and a near-vertical rise in monetary aggregates. And on the other side, words.
Bank and financial stocks under attack
When I want to know how a company is doing, I turn to a chart of its stock price. Long before the headlines are written of a company’s undoing, the stock price has already told the tale. The story currently being told by the stock price of several mid-sized banks, mortgage companies, and bond insurers is nothing short of a disaster in the making.
You need to be paying attention to these next few charts. Remember, Bernanke and Greenspan want you to think that the worst is behind us and that things turned around in March.
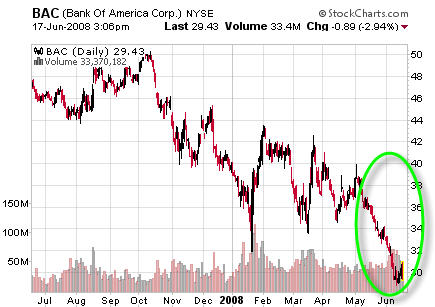
First up is Bank of America (BAC): $130 billion in market capitalization, a giant bank, and the highest bidder for Countrywide Financial Corp (CFC). BAC has lost 42% of its value over the past 8 months and is 10% lower than it was even at its lowest in March. This is an ugly chart and says that BAC is in some pretty serious trouble. Based on this one chart alone, we can say "no, it’s not over yet."
 Now, maybe the market is frowning upon the fact that BAC seems intent, for some reason, on going ahead with their purchase of Countrywide (CFC), which, to this observer, ranks as one of the least fiscally-sound moves of all time. I mean, CFC is saddled with an enormous portfolio of non-performing subprime, no-doc, and option ARM mortgages, not to mention more than 15,000 repossessed properties.
If this is true, then the market should be rewarding the CFC share price while punishing the BAC share price. Let’s see if that’s true…
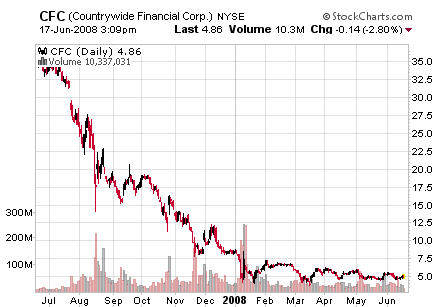 Nope, it’s not true. That, my friends, is as ugly as it gets, and is the chart of a soon-to-be-bankrupt company. So we can pretty much conclude that BAC and CFC are being hammered on the basis of their business models and not as a result of their unholy alliance.
So, what sort of issues could the stock price be telegraphing about BAC? Let’s consider that BAC has a grand total of ~$150 billion in equity, but over $700 billion in level 2 assets (i.e. "modeled value") and an astounding $32,000 billion in derivatives on the books.
In fact, let me print the list of banks with significant derivative exposure, because I’ll be referring to several of these banks here:
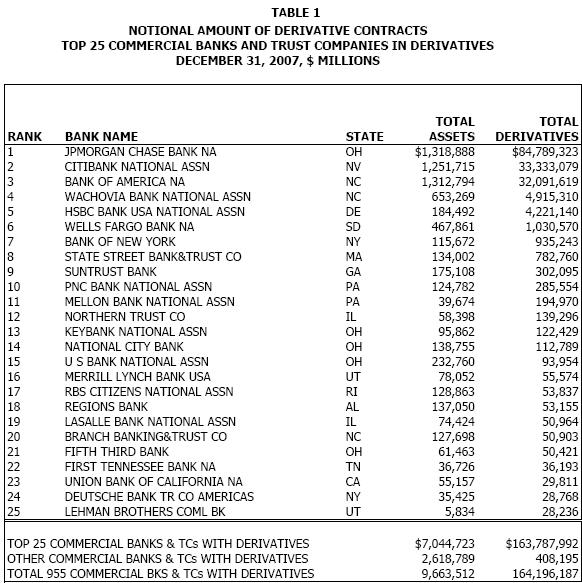 There’s BAC, sitting at #3 on the list with an enormous derivative exposure, and their stock price is sinking like a stone. If Bernanke, et al., are not connecting these dots, then I am extremely worried, because it means they do not know trouble when they see it. But these are really smart folks, so we can fully assume that they are even more aware of this than anybody, leaving us to scratch our heads and wonder why their words do not even remotely match the situation. "Behind us?" Please, not a chance. This thing is just getting underway.
Tip: If you bank with a company whose share price is sinking like a stone, you should think carefully about the joys and sorrows of becoming part of a massive FDIC receivership process.
Speaking of bank stocks giving off some bad odors, consider these:
Citigroup: $107B market cap, 62% loss within the past year, #2 on the derivative list.
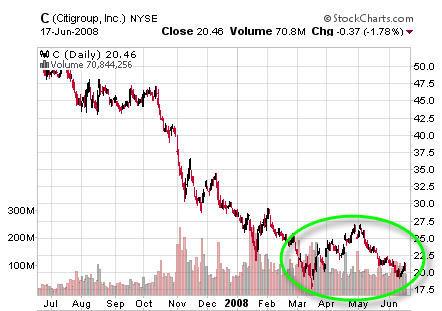 Description: Citigroup Inc. (Citigroup)is a diversified global financial services holding company whose businesses provide a range of financial services to consumer and corporate customers. The Company is a bank holding company. As of March 31, 2008, Citigroup was organized into four major segments: Consumer Banking, Global Cards, Institutional Clients Group (ICG) and Global Wealth Management (GWM). The Company has more than 200 million customer accounts and does business in more than 100 countries.
Wachovia: $36B market cap, 65% loss over the past 8 months, #4 on the derivative list.
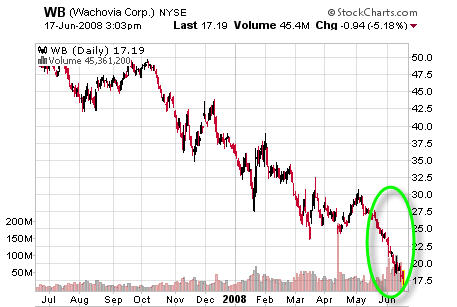 Description: Wachovia Corporation (Wachovia) is a financial holding company and a bank holding company. It provides commercial and retail banking, and trust services through full-service banking offices in 23 states.
Fifth Third Bank Corp: $6.8B market cap, 70% loss within the past year, #21 on the derivative list.
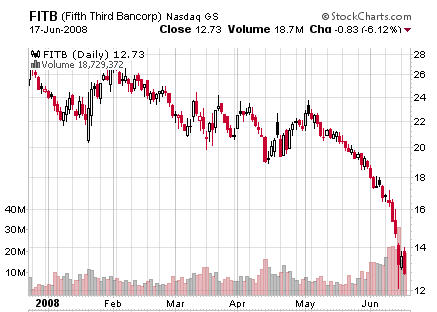 Description: Fifth Third Bancorp (the Bancorp) is a diversified financial services company. As of December 31, 2007, the Bancorp operated 18 affiliates with 1,227 full-service banking centers, including 102 Bank Mart locations open seven days a week inside select grocery stores and 2,211 Jeanie automated teller machines (ATMs) in Ohio, Kentucky, Indiana, Michigan, Illinois, Florida, Tennessee, West Virginia, Pennsylvania and Missouri
Suntrust Bank: $14b market cap, 55% loss within the past year, #9 on the derivative list.
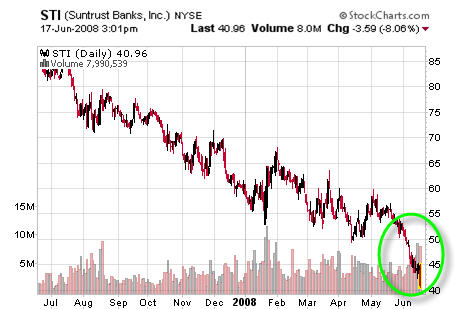 Description: SunTrust Bank (the Bank), the Company provides deposit, credit, and trust and investment services. Through its subsidiaries, SunTrust also provides mortgage banking, credit-related insurance, asset management, securities brokerage and capital market services. The Company operates in five business segments: Retail, Commercial, Corporate and Investment Banking (CIB), Wealth and Investment Management, and Mortgage. The Bank operates primarily in Florida, Georgia, Maryland, North Carolina, South Carolina, Tennessee, Virginia and the District of Columbia.
Fannie Mae: $24B market cap, 65% loss within the past year. Derivative exposure unknown.
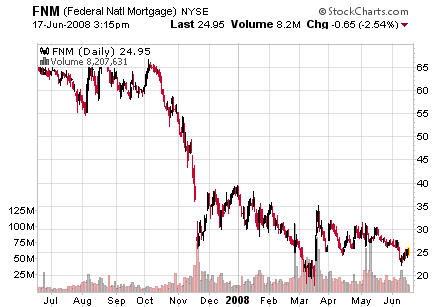 Description: Federal National Mortgage Association (Fannie Mae) is engaged in providing funds to mortgage lenders through its purchases of mortgage assets, and issuing and guaranteeing mortgage-related securities that facilitate the flow of additional funds into the mortgage market. The Company also makes other investments that increase the supply of affordable housing. It is a government-sponsored enterprise (GSE) chartered by the United States Congress and is aligned with national policies to support expanded access to housing and increased opportunities for homeownership. The Company is organized in three business segments: Single-Family Credit Guaranty, Housing and Community Development, and Capital Markets.
General Electric: $287B market cap, 31% loss within the past year, derivative exposure unknown. Note: GE is hugely exposed to finance through its GE Capital division – some wags say that GE is a finance company that also makes stuff.
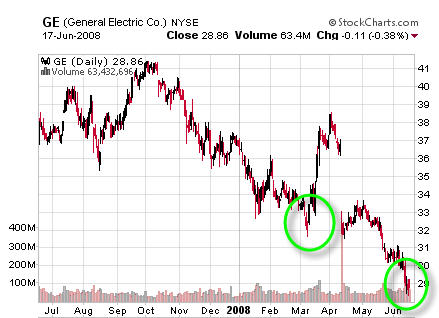 Description: General Electric Company (GE) is a diversified technology, media and financial services company. With products and services ranging from aircraft engines, power generation, water processing and security technology to medical imaging, business and consumer financing, media content and industrial products, it serves customers in more than 100 countries. GE operates in six segments: Infrastructure, Commercial Finance, GE Money, Healthcare, NBC Universal and Industrial.
MBIA: $1.6B market cap, 91% loss within the past year, exposed to $137 billion in Credit Default Swaps.
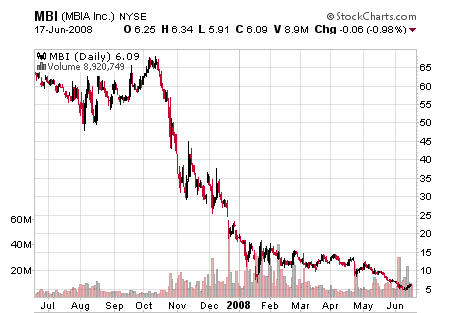 Description: MBIA Inc. (MBIA) is engaged in providing financial guarantee insurance and other forms of credit protection, as well as investment management services to public finance and structured finance issuers, investors and capital market participants on a global basis.
Each one of the above examples is signaling a severe financial crisis. These examples, of which I could pull many more, represent the largest financial company in the world (Fannie Mae), one of the largest banks in the world (BAC), two regional banks (Suntrust and Fifth Third), a national bank (Wachovia), the third largest company in the world (GE), a bond insurance company (MBIA), and a pure-play mortgage company (CFC). In short, we are seeing severe financial weakness across a diverse set of sectors, regions, and products, and I am at a complete loss as to how anyone could view these charts and make the claim that we are out of the woods.
Tip: If your bank is publicly traded, follow the stock closely. At any sign of weakness, get out and get safe.
Summary
Okay, why did I drag you through this tour of stock charts? Because I desperately want you to understand that this party is just getting started. The comforting words of the Federal Reserve are grossly mismatched to the price signals that these very large and very leveraged financial companies are giving off. The charts above are screaming that "something is broken." I don’t know exactly what it is, but my suspicion is that the derivative mess is at the heart of it.
My analysis suggests that the FDIC lacks sufficient funds to adequately insure all of the potential losses. Read my report on the FDIC if you need a refresher on the matter.
As go the financial companies, so goes America.
That’s what this fight is all about, and that is why the Fed is pouring liquidity on the markets even as inflation is screaming higher and ruining lives. The alternative, collapse of our banking system, is viewed as the far greater threat.
And rightly so.
Actions you can take
Financial Distress – Bank Stocks Reveal Urgent Weakness
PREVIEW by Chris MartensonWednesday, June 18, 2008
Executive Summary
- Relatively benign stock market index performance is masking severe financial weakness
- Judging by their stock charts, several good-sized banks might file for bankruptcy soon
- Financial market liquidity supplied by the Fed is at odds with their words that "credit market conditions are improving"
- The assets of the banks under duress are many, many multiples of total FDIC assets
"Pay no attention to the man behind the curtain!" barks the booming voice.
Unfortunately for the dumpy, balding ‘wizard,’ the curtain has already been removed and he’s been spotted.
The first two weeks of June (2008) have been all about knowing where to look. Let’s peel back the curtain.
Let me begin with a personal story. One of my main trading accounts was with a company called Lind-Waldock, a very reputable, stable, old company that got bought out by fast-flying Refco. All seemed well for the first few months, I had the same broker at the other end of the phone and I noticed no difference in my trading experience. But I was wary of Refco, so I kept a live stock chart up on my computer monitor, which I kept a close eye on. One day, the stock price of Refco took a stomach-wrenching dive, losing nearly 20% in a single hour. I immediately called my broker and shifted my funds out of that company that very day. I even got a call from the head of the division asking me to remain, insisting that all was well, and explaining that the stock was falling on the basis of unsubstantiated and certainly untrue rumors. It turns out that the rumors were true; Refco was involved in some shenanigans and had clumsily tried to hide billions in losses by stuffing them in an off-shore subsidiary. Refco was actually insolvent and ultimately went bankrupt. And it was also true that my money would have been safe even had I not moved it, but my position on these matters is to bring the money home and ask the detailed questions later.
Below you will see many examples of stock price performance that would cause me personally to remove my money to a safer location and save the questions for later.
After the dangerous downdraft in the dollar and the stock market seen on Friday the 6th of June, the Federal Reserve and their brethren in Europe, the ECB, were all over the airwaves beginning Sunday the 8th in an attempt to prevent the markets from selling off any further. Judging by the headline stock index performance, they did pretty well, as the indexes closed more or less unchanged for the week. However, if we peek behind the curtains, we see something very different.
I want to focus on the issue of banks and bank solvency. Actually, I want to broaden this definition to include what are termed "financial institutions," which include mortgage brokers and commercial lending institutions. Why? Because we are now a financial economy. Measured in dollars, our economy has much more activity in the business of moving money around than it does in the manufacturing real goods.
It used to be said that "as goes GM, so goes the US," meaning that the economic health of the country could be measured by the activity of its (formerly) largest manufacturer. Now it might be said that "as goes JP Morgan, so goes the country."
Here are the warning signs that major and probably systemic financial distress remains threaded throughout our economy like termite tunnels in a load-bearing beam.
The Fed’s words and actions are not aligned
Bernanke recently said that the risk the economy has entered a substantial downturn "appears to have diminished over the past month or so," while Alan Greenspan said that financial markets have shown a "pronounced turnaround" since March. Which leads us to the recent inflation-fighting words of Bernanke, who said that the Fed would "strongly resist" expectations that inflation will accelerate, hinting at the possibility that interest rates will be raised. Of course, all of these are simply words. What are the actions?
Since you and I know that inflation is caused by too much money lent too cheaply, we’ll spend less time listening to words and more time looking at the monetary data. In other words, let’s pay attention to what they are doing, not what they are saying.
Through a combination of Federal Reserve and Treasury actions, the total amount of liquidity that has been injected into the banking system has advanced over $40 billion in the last 10 days, smashing to a new all-time record of more than $307 billion dollars. If the worst was behind us and inflation was a real concern, this would not have happened. The actions here tell us that the fear of whatever is ailing the banking system vastly outweighs any concerns about inflation.
Further, short-term interest rates are set at 2.0%, which is a full two percent below the rate of inflation. What do you get when you combine negative real interest rates with extremely loose monetary policy? Inflation.
And finally, here’s a chart of the money supply of this nation. If this was a roller coaster ride, you’d be pressed back in your seat staring at the sky – not unlike oil, grains, and other basic commodities.
So there you have it: On the one side, record amounts of liquidity, deeply negative real interest rates, and a near-vertical rise in monetary aggregates. And on the other side, words.
Bank and financial stocks under attack
When I want to know how a company is doing, I turn to a chart of its stock price. Long before the headlines are written of a company’s undoing, the stock price has already told the tale. The story currently being told by the stock price of several mid-sized banks, mortgage companies, and bond insurers is nothing short of a disaster in the making.
You need to be paying attention to these next few charts. Remember, Bernanke and Greenspan want you to think that the worst is behind us and that things turned around in March.
First up is Bank of America (BAC): $130 billion in market capitalization, a giant bank, and the highest bidder for Countrywide Financial Corp (CFC). BAC has lost 42% of its value over the past 8 months and is 10% lower than it was even at its lowest in March. This is an ugly chart and says that BAC is in some pretty serious trouble. Based on this one chart alone, we can say "no, it’s not over yet."
Now, maybe the market is frowning upon the fact that BAC seems intent, for some reason, on going ahead with their purchase of Countrywide (CFC), which, to this observer, ranks as one of the least fiscally-sound moves of all time. I mean, CFC is saddled with an enormous portfolio of non-performing subprime, no-doc, and option ARM mortgages, not to mention more than 15,000 repossessed properties.
If this is true, then the market should be rewarding the CFC share price while punishing the BAC share price. Let’s see if that’s true…
Nope, it’s not true. That, my friends, is as ugly as it gets, and is the chart of a soon-to-be-bankrupt company. So we can pretty much conclude that BAC and CFC are being hammered on the basis of their business models and not as a result of their unholy alliance.
So, what sort of issues could the stock price be telegraphing about BAC? Let’s consider that BAC has a grand total of ~$150 billion in equity, but over $700 billion in level 2 assets (i.e. "modeled value") and an astounding $32,000 billion in derivatives on the books.
In fact, let me print the list of banks with significant derivative exposure, because I’ll be referring to several of these banks here:
There’s BAC, sitting at #3 on the list with an enormous derivative exposure, and their stock price is sinking like a stone. If Bernanke, et al., are not connecting these dots, then I am extremely worried, because it means they do not know trouble when they see it. But these are really smart folks, so we can fully assume that they are even more aware of this than anybody, leaving us to scratch our heads and wonder why their words do not even remotely match the situation. "Behind us?" Please, not a chance. This thing is just getting underway.
Tip: If you bank with a company whose share price is sinking like a stone, you should think carefully about the joys and sorrows of becoming part of a massive FDIC receivership process.
Speaking of bank stocks giving off some bad odors, consider these:
Citigroup: $107B market cap, 62% loss within the past year, #2 on the derivative list.
Description: Citigroup Inc. (Citigroup)is a diversified global financial services holding company whose businesses provide a range of financial services to consumer and corporate customers. The Company is a bank holding company. As of March 31, 2008, Citigroup was organized into four major segments: Consumer Banking, Global Cards, Institutional Clients Group (ICG) and Global Wealth Management (GWM). The Company has more than 200 million customer accounts and does business in more than 100 countries.
Wachovia: $36B market cap, 65% loss over the past 8 months, #4 on the derivative list.
Description: Wachovia Corporation (Wachovia) is a financial holding company and a bank holding company. It provides commercial and retail banking, and trust services through full-service banking offices in 23 states.
Fifth Third Bank Corp: $6.8B market cap, 70% loss within the past year, #21 on the derivative list.
Description: Fifth Third Bancorp (the Bancorp) is a diversified financial services company. As of December 31, 2007, the Bancorp operated 18 affiliates with 1,227 full-service banking centers, including 102 Bank Mart locations open seven days a week inside select grocery stores and 2,211 Jeanie automated teller machines (ATMs) in Ohio, Kentucky, Indiana, Michigan, Illinois, Florida, Tennessee, West Virginia, Pennsylvania and Missouri
Suntrust Bank: $14b market cap, 55% loss within the past year, #9 on the derivative list.
Description: SunTrust Bank (the Bank), the Company provides deposit, credit, and trust and investment services. Through its subsidiaries, SunTrust also provides mortgage banking, credit-related insurance, asset management, securities brokerage and capital market services. The Company operates in five business segments: Retail, Commercial, Corporate and Investment Banking (CIB), Wealth and Investment Management, and Mortgage. The Bank operates primarily in Florida, Georgia, Maryland, North Carolina, South Carolina, Tennessee, Virginia and the District of Columbia.
Fannie Mae: $24B market cap, 65% loss within the past year. Derivative exposure unknown.
Description: Federal National Mortgage Association (Fannie Mae) is engaged in providing funds to mortgage lenders through its purchases of mortgage assets, and issuing and guaranteeing mortgage-related securities that facilitate the flow of additional funds into the mortgage market. The Company also makes other investments that increase the supply of affordable housing. It is a government-sponsored enterprise (GSE) chartered by the United States Congress and is aligned with national policies to support expanded access to housing and increased opportunities for homeownership. The Company is organized in three business segments: Single-Family Credit Guaranty, Housing and Community Development, and Capital Markets.
General Electric: $287B market cap, 31% loss within the past year, derivative exposure unknown. Note: GE is hugely exposed to finance through its GE Capital division – some wags say that GE is a finance company that also makes stuff.
Description: General Electric Company (GE) is a diversified technology, media and financial services company. With products and services ranging from aircraft engines, power generation, water processing and security technology to medical imaging, business and consumer financing, media content and industrial products, it serves customers in more than 100 countries. GE operates in six segments: Infrastructure, Commercial Finance, GE Money, Healthcare, NBC Universal and Industrial.
MBIA: $1.6B market cap, 91% loss within the past year, exposed to $137 billion in Credit Default Swaps.
Description: MBIA Inc. (MBIA) is engaged in providing financial guarantee insurance and other forms of credit protection, as well as investment management services to public finance and structured finance issuers, investors and capital market participants on a global basis.
Each one of the above examples is signaling a severe financial crisis. These examples, of which I could pull many more, represent the largest financial company in the world (Fannie Mae), one of the largest banks in the world (BAC), two regional banks (Suntrust and Fifth Third), a national bank (Wachovia), the third largest company in the world (GE), a bond insurance company (MBIA), and a pure-play mortgage company (CFC). In short, we are seeing severe financial weakness across a diverse set of sectors, regions, and products, and I am at a complete loss as to how anyone could view these charts and make the claim that we are out of the woods.
Tip: If your bank is publicly traded, follow the stock closely. At any sign of weakness, get out and get safe.
Summary
Okay, why did I drag you through this tour of stock charts? Because I desperately want you to understand that this party is just getting started. The comforting words of the Federal Reserve are grossly mismatched to the price signals that these very large and very leveraged financial companies are giving off. The charts above are screaming that "something is broken." I don’t know exactly what it is, but my suspicion is that the derivative mess is at the heart of it.
My analysis suggests that the FDIC lacks sufficient funds to adequately insure all of the potential losses. Read my report on the FDIC if you need a refresher on the matter.
As go the financial companies, so goes America.
That’s what this fight is all about, and that is why the Fed is pouring liquidity on the markets even as inflation is screaming higher and ruining lives. The alternative, collapse of our banking system, is viewed as the far greater threat.
And rightly so.


